
You’ve got revenue streams flowing from every corner product sales, subscriptions, affiliate deals but behind every “order placed” notification is a complex web of expenses quietly eating into your margins.
Today, we break open that black box.
Building on everything we’ve unpacked so far from your order-to-cash cycle to your chart of accounts and revenue streams this section is where theory meets your monthly bill.
Unlike traditional retail, e-commerce expenses don’t just show up on a receipt. They’re scattered across platforms, hidden in payment processor fees, baked into shipping contracts, and buried under return policies and ad campaigns.
And if you don’t track them precisely, they’ll track your profits down.
From COGS and fulfillment to marketing, returns, chargebacks, and tech stack creep we’ll cover 12 core expense categories every modern e-commerce business needs to understand.
This isn’t just about categorizing your costs.
It’s about commanding them.
The Real Price of Selling Online: How Expenses Shape (or Sink) Your Profit
Let’s be honest most e-commerce founders don’t wake up excited to open their expense reports.
But here’s the harsh truth: the silent killers of your margin aren’t your competitors… they’re your own operations.
The E-commerce Expense Jungle
In a typical online business:
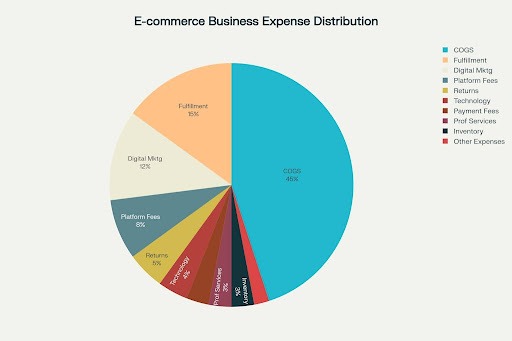
- COGS eats up 40–50% of your revenue.
- Fulfillment and logistics? Another 10–20%.
- And then there’s marketing, software, returns, platform fees… it stacks up fast.
Unlike brick-and-mortar stores, e-commerce expenses come from all directions across borders, platforms, and seasons.
The mess? It’s not just inconvenient.
It’s dangerous.
Companies that don’t track expenses by category and channel consistently overestimate margins by 20–30%.
The Strategic Expense Framework
Expenses in e-commerce aren’t just costs they’re behavior patterns.
Some rise with seasonality. Some spike with ad spend. Some bleed quietly in the background (looking at you, fulfillment overcharges and failed FB campaigns).
That’s why we need more than just expense tracking we need expense intelligence.
Key Expense Categories You Must Master:
1. COGS: The Foundation Layer
Think: product cost + freight + duties + packaging.
Getting this wrong? You’ll mess up your pricing, taxes, and profitability in one go.
✅ Automate inventory tracking.
✅ Allocate shared costs like freight proportionally.
✅ Avoid guessing. Guessing in COGS = bleeding margins.
Pro tip: Automating COGS closes your books 40% faster.
2. Fulfillment: Where Things Go Quietly Wrong
Every package that leaves your warehouse is a cost event:
- Warehousing
- Packing labor
- Shipping & carrier fees
- Return handling
Outsource it all to Amazon FBA? You’re paying 15–20% of product value.
Self-fulfilling? You’ll need smart tools or you’re burning time and cash.
Brands that optimize this save 25% in shipping and deliver 40% faster.
3. Marketing & Customer Acquisition
Your ads may be bringing in traffic…
…but are they bringing profitable traffic?
- Google ads: $1–3 per click
- Facebook: $0.50–2.00 per click
- Content, email, SEO all add up
The best brands know their CAC by channel. And they watch the LTV:CAC ratio like it’s their heart rate.
Target: 3:1 LTV to CAC
Automation = 40% better ROI attribution
This is just the start. In the next section, we’ll unpack returns, payment processing, fraud, and even tech stack expenses that silently leak thousands per year.
The Hidden “Transaction Tax” That’s Eating Your Revenue
Let’s call it what it is:
Every sale comes with a silent toll.
Swipe a card, tap Apple Pay, or complete a checkout with PayPal and boom:
2.5–4% of your revenue vanishes.
Breaking Down the Toll Booth
Here’s where your money actually goes:
- PayPal: 2.59–3.49% + $0.49 per transaction
- Stripe / Credit Cards: 2.4–2.9% + $0.30 per transaction
- Chargebacks: $20–40 per hit
- FX conversion fees: For international orders, it gets spicier.
If you’re processing $1M a year, you’re quietly paying $25,000–$40,000 in just processing fees.
That’s not a rounding error that’s a new hire.
Smart Payment Optimization Isn’t Optional
What separates thriving stores from struggling ones?
They don’t just accept fees they engineer around them.
Here’s how:
- Dynamic routing: Send transactions through lower-cost processors
- Preferred payment incentives: Encourage customers to use cheaper methods
- PCI Compliance: Avoid hefty penalty fees from non-compliance
Brands that optimize payments cut costs by 15–25%.
Brands that ignore them? Bleed slowly and silently.
| Expense Category | Typical % of Revenue | Monthly Cost Range | Key Components |
| Cost of Goods Sold (COGS) | 40-50% | $2,000 – $50,000+ | Product cost, freight, packaging, import duties |
| Fulfillment & Logistics | 10-20% | $500 – $8,000 | Warehousing, picking, packing, shipping |
| Digital Marketing (CAC) | 8-15% | $300 – $5,000 | PPC ads, social media, email marketing, SEO |
| Payment Processing Fees | 2.5-4% | $100 – $2,000 | Credit card fees, PayPal, Stripe transaction costs |
| Platform/Marketplace Fees | 5-15% | $200 – $3,000 | Amazon FBA, Shopify fees, eBay final value fees |
| Technology & Software | 2-5% | $100 – $1,500 | Accounting software, CRM, analytics tools |
| Returns & Reverse Logistics | 3-8% | $200 – $1,500 | Return shipping, restocking, processing fees |
| Professional Services | 2-4% | $200 – $800 | Bookkeeping, tax preparation, legal consulting |
| Inventory Carrying Costs | 20-30%* | $300 – $2,000 | Storage costs, insurance, capital tied up |
| International Shipping/Duties | 5-15%** | $200 – $2,500 | Customs duties, VAT, international freight |
| Customer Support | 1-3% | $150 – $800 | Chat support, phone support, help desk tools |
| Legal & Compliance | 1-2% | $100 – $500 | Business licenses, tax compliance, contracts |
Platform & Marketplace Fees: Your Channels Aren’t Free
You’re not just selling on Amazon or Shopify
You’re renting space in a digital mall, and the rent’s due every second.
Whether it’s FBA, Etsy, eBay, or Shopify every channel has a different meter running.
Let’s break it down:
- Amazon: Referral fees (6–45%) + FBA charges ($3–6/unit)
- eBay: Final value fees (3.49–12.55%)
- Shopify: $29–299/month + 2.4–2.9% per transaction
- Etsy: $0.20/listing + 6.5% on every sale
That’s 5–15% of your revenue gone, even before fulfillment.
Want to grow profitably?
You have to analyze profitability per channel not just in total.
Top operators:
- Negotiate volume discounts
- Avoid high-referral-fee categories
- Use smart inventory mapping across platforms
Pro tip:
Brands that run channel-level P&Ls outperform others by 20–30% on margin.
Returns & Reverse Logistics: The Profit Drain Nobody Tracks
Here’s the ugly truth:
A return isn’t just a refund it’s a logistics migraine.
- Average return rate: 18.1%
- Hidden costs: return shipping, inspection, relabeling, disposal
- Loss per return? 20–65% of item value
It’s not just a cost center. It’s a brand moment.
Leaders in the game:
- Use AI to predict return-prone SKUs
- Write precise descriptions to prevent expectation gaps
- Build efficient reverse logistics to cut restocking costs
If you’re not fixing this leak, it’s slowly draining your profit.
Tech & Pro Services: The Stack Behind the Scale
Tech is your backbone or your bottleneck.
From inventory to ads to accounting, the tools you use shape how fast (and how cleanly) you grow.
Here’s the stack most operators use:
- Accounting Software: $50–$500/month
- CRM / Email / Analytics tools: $12–$500/month
- Inventory + Fulfillment: $100–$1,000/month
Businesses with disconnected tools leak 25–35% more on operations.
Integrated software = faster workflows, clearer numbers, happier customers.
Professional Services: Your Secret Weapons
Let’s stop pretending founders can do it all.
- Bookkeeping: $200–$600/month
- Ecom Accounting: $400–$2,500/month
- Tax Compliance (US & Intl): $500–$10,000/year
- Legal Support: $1,000–$5,000/year
Businesses that invest here?
50% fewer compliance issues
30% better cash flow
Because clarity isn’t optional. It’s a competitive edge.
Expense Optimization Isn’t Just a Task — It’s a Growth Lever
Let’s be honest: most operators track revenue religiously…
…but when it comes to expenses, it’s vibes and gut feeling.
That’s where things fall apart.
Smart Allocation = Real Profit Clarity
You can’t improve what you can’t see.
Want to know which product is actually profitable?
Or which channel is leaking money quietly?
Then you need allocation done right not guesswork.
Top operators use:
- Activity-Based Costing to split fulfillment & marketing across SKUs
- CAC by Channel to fine-tune ad spend
- Contribution Margins to shape pricing strategy
Brands that nail this?
They make 40% better pricing decisions and 25% smarter product bets.
Financial Intelligence Starts With Clean Pipes
Here’s the big unlock:
Real-time expense visibility → better cash flow → faster moves.
The only way?
Automated cost tracking across your entire stack.
With automation, you get:
- 90% fewer data errors
- 60% faster month-end closes
- Daily visibility into what’s draining your margin
And the ROI?
Most tools pay for themselves in 6–12 months flat.
Benchmarks, Not Blind Spots
Don’t operate in isolation.
Smart founders regularly benchmark:
- Gross margin per SKU & channel
- Fulfillment cost per order
- CAC trends over time
And here’s the kicker:
Top brands using this intel don’t just trim fat
They re-allocate firepower to what’s working best.
Strategic Cost Management = Profit Rocket Fuel
Not all costs behave the same.
Some grow with volume.
Others sit there, fixed and heavy.
The smart play?
- Negotiate volume-based supplier deals
- Shift ad budgets to high-ROI channels
- Use just-in-time inventory to slash storage costs
The result?
20–30% better overall profitability without selling more units.
Connecting Revenue & Expense = Operator Superpower
This week, we decoded revenue (Day 5) and expense (Day 6) structures.
Now imagine this:
Real-time P&L by product
Channel profitability by region
Dynamic pricing based on margin intel
That’s what world-class operators run.
Not spreadsheets. Not guesswork.
But integrated dashboards that drive decisions.